My last blog pointed out the importance of the machine power and that it’s impossible to regain performance on the higher architectural layers when the machine power isn’t adequate. This time I want to focus on another very important performance adjusting screw – the JVM and especially Garbage Collection (GC).
GC tuning is in most cases an indispensable prerequisite for good performance on non-trivial projects from a certain size (and Oracle SOA Suite project are designated to this category). Unfortunately, it's also for SOA Suite projects not an easy and one-off task. Most likely it will take some optimization iterations where you measure your GC behavior, tune the GC stetting and measure again. And even when you find the right GC settings for the moment you have to monitor GC behavior over the time because raising number of SCA Composites, more SCA Service calls or higher data volume will change the GC behavior. It’s also safe to keep basic GC logging in the production system.
Good thing about GC tuning is that there are plenty of good articles and blogs describing how to do meaningful GC tuning. I neither want to repeat all the available stuff nor I want to go through all 50+ parameters of the Sun Hotspot JVM. Instead I want to give some helpful GC hints on the JVM which are important during our own JVM tuning for SOA Suite, rarely mentioned or difficult to find. So make yourself familiar with the JVM basics if this didn’t happen so far.
First of all when you want to do JVM tuning you need a GC analyzing tool like HPjmeter to visualize GC behavior. Some tools could perform real-time monitoring but it’s sufficient to offline analyze the GC log files. Raw GC log file analyzing without a tool is a time-consuming task and needs a certain experience level.
Basic GC logging parameters: –verbose:gc –XX:+PrintGCDetails –XX:+PrintGCTimeStamps – Xloggc:<file>.
The –XX:+PrintGCDetails option provides the details needed for GC tuning. The –XX:+PrintGCTimeStamps setting causes that time stamps are printed at GC. The time stamp for a GC event is indicating the amount of elapsed time since the JVM launched (approximately matching with the Weblogic Server Activation Time which is shown on the Weblogic Console). When it is desirable to know the exact wall clock time over a time stamp representing the time since JVM launch, you could use the -XX:+PrintGCDateStamps setting which enables the printing of a localized date and time stamp indicating the current date and time.
The most obvious and important parameter is the right JVM Memory sizing which has to be aligned to the physical memory. Make sure the JVM always has 100% of the memory it needs, do not over-committing memory because the JVM Memory is an active space where objects are constantly being created and garbage collected (memory over-committing is the process of allocating more JVM Memory than there is physical memory on the system). Such an active memory space requires its memory to be available all the time. I was reading about a recommendation not to use more than 80% of the available RAM which is not taken by the operating system or other processes. Too small JVM Heap memory sizing will lead in worst case to an out-of-memory error already during startup or many Full GC Collections from the beginning. Too large JVM Heap memory sizing will pause your application for several tens of seconds. As a general rule of thumb, as the JVM Heap size grows, so does the overhead of GC for the JVM process. In order to give you a ballpark figure, if you have below 50 SCA Composites, I would recommend starting with 4 GB JVM memory (-Xmx4g) on your Weblogic Managed Servers. During your optimization, try to reduce the JVM Heap size if possible to get shorter GC times and to avoid wasting memory. If the JVM Heap always settles to 85% free, you might set the Heap size smaller.
Note: A common misunderstanding is to assume that the –Xmx value is equal to the Java Process memory needed, but the JVM Memory (or Java Process Memory) is greater than JVM Max Heap (greater than –Xmx) and this is due to the other additional JVM areas outside of the JVM Heap that make up the memory space of the total Java process such as JVM Perm Size (-XX:MaxPermSize), [number of concurrent threads]*(-Xss), and the “Other JVM Memory” section. The –Xss option is the Java thread stack size setting. Each thread has its own stack, its own program counter, and its own local variables. The default size is Operating System and JVM dependent, and it can range from 256k to 1024k. Each thread is given exactly the amount specified. There is no starting or maximum stack size. Since the default –Xss stetting is often too high, tuning it down can help save on memory used and given back to the Operating System. Tune down to a range that doesn’t cause StackOverflow errors. The “Other JVM Memory” is additional memory required for JIT Code Cache, NIO buffers, classloaders, Socket Buffers (receive/send), JNI and GC internal info.

Therefore the final JVM Memory calculation has to happen with this formula:
JVM Memory = JVM Max Heap (-Xmx) + JVM Perm Size (-XX:MaxPermSize) + [number of concurrent threads] * (-Xss) + “Other JVM Memory”
Typically “Other JVM Memory” is not significant however can be quite large if the application uses lots of NIO buffers, and socket buffers. Otherwise it’s safe assuming about 5% of the total JVM Process memory.
Check that you have an activation of "-server" JVM Hotspot JIT. It delivers best performance for SOA Suite running servers after a fair amount of time to warm up (keep in mind that the Domain configuration wizard configures “-client” when you create a Domain in development mode). The server mode has differences on the compiler and memory defaults tuned to maximize peak operating speed for long-running server applications (doing more code analysis and complex optimizations). The old rule for Server JVMs to put initial Heap size (-Xms) equal to maximum Heap size (-Xmx) is still valid. Otherwise you get Heap increase on the fly which always requires a Stop-The-World (STW) GC, even if the resizing is very tiny.
Equalization of memory values is also a good approach for the Permanent Space which is allocated outside of the Java Heap. Permanent Space is used for storing meta-data describing classes that are not part of the Java language. The -XX:PermSize setting specifies the initial size that will be allocated during startup of the JVM. If necessary, the JVM will allocate up to -XX:MaxPermSize setting. JVM efficiency is improved by setting PermSize equal to MaxPermSize. This Non-Heap memory area is pretty stable to my observations. Observe PermSpace usage and adjust accordingly by using tools like JConsole or VisualVM.
Keep always in mind that you should consider to scale-out an application to multiple JVMs (=Weblogic Managed Servers) even on the same host (so-called vertical clustering). Horizontal clustering is clustering across hardware boundaries for both load balance and failover as first objective. Even though for a 64 bit system, there is theoretically no upper memory limit but the constraint of available physical memory. But again, too large heap sizes certainly can cause GC STW problems. Smaller JVM heap sizes running on more JVMs is the solution implemented with vertical and horizontal clustering. There is no “gold rule”, optimal JVM heap size and number of JVMs (= Managed Servers) could only be found through performance testing simulating average and peak load scenarios (use tools like the supplied Oracle Enterprise Manager Fusion Control, professional tools like HP LoadRunner or open source tools like Apache JMeter and soapUI).
Most important besides the right JVM memory sizing is the choice of the right GC strategy or also called GC scheme. You have to decide between the optimization goals of maximum throughput and minimum pause time. You couldn’t have both. So if you have a domain doing online processing where users are waiting for quick response you would like to optimize for minimum pause time. On the other hand, if you have a domain doing batch processing and your SCA Services are not involved on an interactive application you could effort longer pause time, than you would like to optimize for maximum throughput (that’s also a reason why I recommend on my last blog a domain split in a scenario were you have to do online processing and batch processing).
The acceptable rate for Garbage Collection is for sure application-specific but the Oracle documentation mentions that a best practice is to tune the time spent doing GC to within 5% of execution time (which is already a high value in my opinion). Full Garbage Collection should in general not take longer than 3 to 5 seconds.
Let’s take a look on the GC scheme settings. Today most of the environments operate on (several) Multi Core/CPUs. I assume that your SOA Suite machine(s) have Multi Core/CPUs and therefore we could neglect the special settings for Single Core/CPU environments. Here are the two important Sun JVM Flags to choose the right GC strategy:
| | Maximum Throughput
(pause-times are not an issue) | Minimum Pause Time (pause-times are minimized) |
| Sun JVM Flag | -XX:+UseParallelGC | -XX:+UseConcMarkSweepGC |
| Young Generation (Eden Space + Survivor Spaces) (Scavenges) | Parallel Young GC (stop-the-world parallel mark-and-copy) | Parallel Young GC (stop-the-world parallel mark-and-copy) |
| Old Generation (Tenured Space) | Parallel Old GC (stop-the-world parallel mark-and-compact) | CMS GC (concurrent mark-and-sweep) |
Parallel GC scheme is stopping the application execution and is using as many threads as possible (and therefore all available CPU resources) to clean up memory. GC STW happens. Concurrent GC scheme attempts to minimize the complete halting of the application execution as much as possible by performing the GC logic in parallel within threads that run concurrently with the application logic threads. Anyway, even Concurrent Mark-and-Sweep (CMS) will cause GC STW but less and shorter than a Parallel GC. Take a look at the GC log file, only the “CMS-initial-mark” and “CMS-remark” phase is causing GC STW. The marking and remarking pauses are directly proportional to the amount of objects in the Old Generation (Tenured Space). Longer pauses indicate a lot of tiny objects.
The JVM offers also two settings to control how many GC threads are used in the JVM. The –XX:ParallelGCThreads setting controls the number of threads used in the Parallel GC. The -XX:ConcGCThreads setting let you control the number of threads Concurrent Garbage Collectors will use.
On smaller multiprocessor machines with less than or exactly 8 CPU Cores you will configure the number of parallel threads equal to the CPU Cores.
–XX:ParallelGCThreads = [number of CPU Cores]
For example, if there are two Dual-Core Processors you will have a setting of 4 threads. If there are using 4 Dual-Core Processors or 2 Quad-Core processors you will have a setting of 8 threads.
On medium to large multiprocessor machines don't set the number of GC threads to be the same as the CPU Cores (there are diminishing returns). This is the formula to do the thread configuration for machines with more than 8 CPU Cores.
–XX:ParallelGCThreads = 8 + (([number of CPU Cores] – 8) * 5)/8
You get 1 parallel GC thread per CPU Core for up to 8 CPU Cores. With more CPU Cores the formula reduces the number of threads. For example for 16 CPU Cores you get: 8+((16-8)*5)/8 = 13 GC threads.
The number of threads for the CMS process is dependent on the number of the threads for the parallel GC.
-XX:ConcGCThreads = ([number of ParallelGCThreads] + 3) / 4
But be rather conservative and not too aggressive with the thread setting especially when you are doing vertical clustering. In a virtual environment the calculation is based on the number of CPU Cores assigned to the Guest OS.
Also be aware that CMS leads over the time to some Heap fragmentation which will cause the JVM to switch to a Mark-and-Compact collector. A mix of both small and large objects would fragment the Heap sooner. The JVM needs to find a block of contiguous space for the size of the object and this will slow down the JVM. There is a JVM parameter that could be used to detect fragmentation (-XX:PrintFLSStatistics=2) but it slows down the GC significant. Consider that most likely a SOA Suite Batch Domain has to handle larger objects than an Online Application Processing Domain.
The new Garbage-First (G1) Garbage Collector (testable since Java SE 6 update 14 Early Access Package and officially available since Java SE 7 Update 4) will be the long-term replacement for CMS and targets medium to large multiprocessor machines and large Heap sizes. Unlike CMS, G1 compacts to battle fragmentation and to achieve more-consistent long-term operation. But the first Weblogic Server version which supports JDK 7 is 12c.
When you do the JVM sizing you should know how large the JVM Heap sections are and when GC is triggered. Only with this knowledge you could do meaningful sizing and react on the number given by the GC log files.
These formulas are helpful to calculate the JVM Heap memory sizes:
| Space | Calculation |
| Eden Space | NewSize – ((NewSize / (SurvivorRatio +2)) * 2) |
| Survivor Space (To) | (NewSize – Eden) / 2 |
| Survivor Space (From) | (NewSize – Eden) / 2 |
| Tenured Space | HeapSize – Young Generation |
These formulas give you the real sizes of the generational JVM spaces. The Survivor Spaces serves as the destination of the next copying collection of any living objects in Eden Space and the other Survivor Space. Keep in mind that one Survivor Space is empty at any given time. Now it’s on you to monitor the GC behavior, do the right GC scheme setting, to calculate the optimized heap sizes and number of threads, doing the best non-heap size settings.
Let me show you an example on how successful GC optimization could improve your overall performance on SOA Suite Services running at a Weblogic Domain with two Managed Servers (SOA Suite 11g PS4, WLS 10.3.5, JDK 1.6.0_27 running on Solaris).
The story started with a default ParallelGC scheme setting (default GC values for JDK 6: -XX:+UseParallelGC, ParallelGCThreads=#CPU, SurvivorRatio=32, PermSize=64m, no GC logging) and a JVM heap size of 4 GB.
-server –Xms4g –Xmx4g –Xss512k -XX:PermSize=768m -XX:MaxPermSize=768m –verbose:gc –XX:+PrintGCDetails –XX:+PrintGCTimeStamps – Xloggc:/gc.out
The initial 4 GB JVM Heap size setting was discussed with Oracle and the Permanent Space setting is coming from first observation. The 64bit JDK6 stack size on Solaris is 1024k. We reduced the thread stack size on 512k.
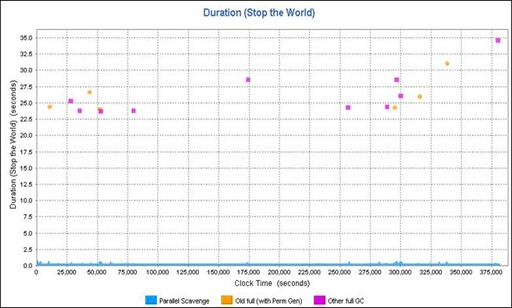
After running some HP LoadRunner Average Load Tests, the HP JMeter GC STW diagram was showing GC STW activities between 23 and 35 seconds.

This was unacceptable for an Online Processing Domain where a user is waiting for response. SCA Services shouldn’t be blocked by 35 seconds freezing the execution. In order to optimize for minimal pause time the GC scheme changed on CMS (–XX:+UseConcMarkSweepGC).
-server –Xms4g –Xmx4g –Xmn2g –Xss512k –XX:PermSize=768m –XX:MaxPermSize=768m –XX:+UseConcMarkSweepGC –XX+UseParNewGC –XX:+CMSParallelRemarkEnabled – XX:+UseCMSInitiatingOccupancyOnly –XX:CMSInitiatingOccupancyFraction=55 –XX:+CMS ClassUnloadingEnabled –XX:ParallelGCThreads=8 –XX:SurvivorRatio=4 –verbose:gc –XX:+PrintGCDetails –XX:+PrintGCTimeStamps – Xloggc:/gc.out
The -Xmn2g setting configures the Young Generation Heap size. A parallel Young Generation collector (–XX+UseParNewGC) is best used with the CMS low pause collector that collects the Tenured Space. The –XX:+CMSParallelRemarkEnabled setting enables multiple parallel threads to participate in the remark phase of CMS. Since this is a STW phase, performance is improved if the collector uses multiple CPU Cores while collecting the Tenured Space. The –XX:CMSInitiatingOccupancyFraction setting on 55 means that CMS GC starts at 55% memory allocation (default is 68%). The – XX:+UseCMSInitiatingOccupancyOnly setting forces CMS to accept the –XX:CMSInitiatingOccupancyFraction setting and not starting the CMS collection before the threshold is reached (disables internal JVM heuristics, without this setting the JVM may not obey CMS initiating occupancy fraction setting). The -XX:+CMSClassUnloadingEnabled setting activates the class unloading option. It helps to decrease the probability of “Java.lang.OutOfMemoryError: PermGen space” errors.
Here is the calculation on the JVM Heap memory size with the given parameter.
| Space | Calculation | MB | KB |
| Eden Space | 2048m – ((2048m / (4 +2)) * 2) | 1365.3 | 1398101.33 |
| Survivor Space (To) | (2048m – 1365.3m) / 2 | 341.35 | 349525.335 |
| Survivor Space (From) | (2048m – 1365.33m) / 2 | 341.35 | 349525.335 |
| Tenured Space | 4096m – 2048m | 2048 | 2097152 |
So the Tenured Space (Old Generation) cleanup starts at a filling size of 1153433.6 KB (1126.4 MB).
Further average and performance load tests reported that the GC STW activities went down on a maximum of around 10 seconds for most CMS GC STW, but 10 seconds are still too long and STW activities happened much too often.

We analyzed the GC logs which reported Concurrent Mode Failures like the following GC entry.
238276.333: [GC 238276.334: [ParNew: 1709331K->1709331K(1747648K), 0.0001286 secs]238276.334: [CMS238276.640: [CMS-concurrent-mark: 13.637/14.048 secs]
(concurrent mode failure): 1663134K->1619082K(2097152K), 53.1504117 secs] 3372466K->1619082K(3844800K)
Concurrent Mode Failure means that a requested ParNew collection didn’t run because GC perceives that the CMS collector will fail to free up enough memory space in time from Tenured Space. Therefore worst case surviving Young Generation objects couldn’t be promoted to the Tenured Space. Due it this fact, the concurrent mode of CMS is interrupted and a time-consuming Mark-Sweep-Compact Full GC STW is invoked.
On GC log file entry mentioned above the ParNew request happens at JVM Clock Time 238276.333 whereas the Young Generation had a fill level of 1709331 KB (1669.27 MB) out of 1747648 KB (1706,69 MB). This means a filling level of 97.8% out of 1747648 KB (rounded: 1706 MB = 1365 MB Eden Space + 341 MB One Survivor Space). The GC STW happens at Clock Time 238276.334 and took 53.15 seconds. The Tenured Space occupancy dropped from 1663134 KB (1624 MB) to 1619082 KB (1581 MB). This means that 97.5% of all objects survived the Tenured Space clean-up. Only 43 MB of the Tenured Space is getting freed.
So the Young Generation had around 1669 MB before GC which could only free 43 MB on the Old Generation. The Tenured Space seems not big enough to keep all the promoted objects. There is an Oracle recommendation when changing from a Parallel GC scheme to a Concurrent GC scheme. Oracle recommends increasing the Tenured Space by at least 20% to 30% in order to accommodate fragmentation.
We decided to keep the overall JVM Heap size stable and instead to decrease the Young Generation in order to give the Old Generation more space (-Xmn2g to – Xmn1g).
-server –Xms4g –Xmx4g –Xmn1g –Xss512k –XX:PermSize=768m –XX:MaxPermSize=768m –XX:+UseConcMarkSweepGC –XX+UseParNewGC –XX:+CMSParallelRemarkEnabled – XX:+UseCMSInitiatingOccupancyOnly –XX:CMSInitiatingOccupancyFraction=55 –XX:+CMS ClassUnloadingEnabled –XX:ParallelGCThreads=8 –XX:SurvivorRatio=4 –verbose:gc –XX:+PrintGCDetails –XX:+PrintGCTimeStamps – Xloggc:/gc.out
Here is the new calculation on the JVM Heap memory size after changing Young Generation on 1 GB.
| Space | Calculation | MB | KB |
| Eden Space | 1024m – ((1024m / (4 +2)) * 2) | 682.66 | 699050.66 |
| Survivor Space (To) | (1024m – 682.66m) / 2 | 170,67 | 174766.08 |
| Survivor Space (From) | (1024m – 682.66m) / 2 | 170,67 | 174766.08 |
| Tenured Space | 4096m – 1024m | 3072 | 3145728 |
Afterwards we triggered a new Average Load Test. The GC STW activities went down to a maximum of 4.3 seconds, but much more important is the fact that GC STW significantly less frequently happens.

This was good for the Average Load Tests, but a Peak Performance Test was showing an accumulation of CMS GC STW activities during the Performance Test (around Clock Time 200000).

We decided to do a resizing and slightly increased Young Generation (from –Xmn1g to –Xmn1280m) in order to allow objects to be held longer in Young Generation with the hope that they will be collected there and are not promoted to Old Generation. As mentioned by Oracle Doc ID 748473.1, most of the BPEL engine’s objects are short lived. Therefore the Young Generation shouldn’t be too small.
The Survivor Spaces allow the JVM to copy live objects back and forth between the two spaces for up to 15 times to give them a chance to die young. The –XX:MaxTenuringThreshold setting governs how many times the objects are copied between the Survivor Spaces (the default value is 15 for the parallel collector and is 4 for CMS). Afterwards the objects are old enough to be tenured (copied to the Tenured Space). So we increased also the Survivor Spaces (from –XX:SurvivorRatio=4 to –XX:SurvivorRatio=3, see calculation below). Additionally we increase the –XX:CMSInitiatingOccupancyFraction setting on 80% in order to make use of the large Old Generation capacity.
-server –Xms4g –xmx4g –Xmn1280m –Xss512k –XX:PermSize=768m –XX:MaxPermSize=768m –XX:+UseConcMarkSweepGC –XX+UseParNewGC –XX:+CMSParallelRemarkEnabled – XX:+UseCMSInitiatingOccupancyOnly –XX:CMSInitiatingOccupancyFraction=80 –XX:+CMS ClassUnloadingEnabled –XX:ParallelGCThreads=8 –XX:SurvivorRatio=3 –verbose:gc –XX:+PrintGCDetails –XX:+PrintGCTimeStamps – Xloggc:/gc.out
This means the following new JVM Heap sizes:
| Space | Calculation | MB | KB |
| Eden Space | 1280m – ((1280m / (3 +2)) * 2) | 768 | 786432 |
| Survivor Space (To) | (1280m – 768m) / 2 | 256 | 262144 |
| Survivor Space (From) | (1280m – 768m) / 2 | 256 | 262144 |
| Tenured Space | 4096m – 1280m | 2816 | 2883584 |
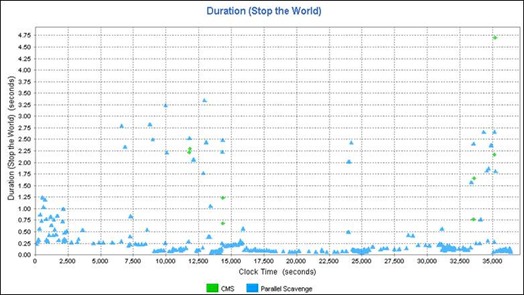
Now the Old Generation cleanup starts at a filling size of 2252.8 MB. Take a look at the following GC STW diagram which confirms the GC tuning effort. The diagram reports a well-tuned JVM with relatively large number of short Parallel Scavenges with less frequent, but more expensive, full CMS GC.

More GC fine tuning and better GC behavior is for sure possible. But we are quite satisfied with the reached performance results. The SCA Services have much better response times on Average and Peak Performance Tests.
Finally you have to keep a closer eye on the Code Cache of the JVMs running your Weblogic Servers with SOA Suite. It has nothing to do with GC, but here is the explanation why it’s important. As you all know, Java code is getting compiled to bytecode for the JVM. Bytecode has to be converted to native instructions and library calls for the target platform. The interpreted mode always converts bytecode “as it used” which slows down the execution performance. Whereas the Just-In-Time (JIT) compilation keeps preparative compiled code segments (performance-critical “Hotspots”) in a Code Cache, the cached native compiled code is getting reused later without needing to be recompiled (for example in loops). That’s the reason why the JVM over time obtain near-native execution speed after the code has been run a few times.
So it’s performance critical when you have warnings like …
Java HotSpot(TM) Client VM warning: CodeCache is full. Compiler has been disabled.
Java HotSpot(TM) Client VM warning: Try increasing the code cache size using -XXReservedCodeCacheSize=
You can imagine how bad it would be if JIT’ing is switched off because the Code Cache is getting full (default Code Cache size with –server option and 64bit is 48 MB). The Non-Heap Code Cache is allocated during JVM startup and, once allocated, it cannot grow or shrink. Fortunately the Code Cache size could be changed with the -XX:ReservedCodeCacheSize setting. But increasing the Code Cache size will only delay its inevitable overflow. Therefore is more important to avoid the performance breaking interpreted-only mode. The -XX:+UseCodeCacheFlushing setting enables the compiler thread to cycle (optimize, throw away, optimize, throw away), that’s much better than disabled compilation. So if you see that Code Cache warning I would recommend to slightly increase the Code Cache size and to enable Code Cache Flushing. The –XX:+PrintCompilation setting give you more details (or watch the Code Cache behavior on JConsole).
I just want to leave you with three more tips for your own JVM GC tuning. There is a JVM setting -XX:+PrintFlagsFinal which will show you all JVM settings during the startup phase. Second tip is a suppression of programmatic caused Full GC STW by using the System.gc() and Runtime.getRuntime().gc() methods. The -XX:+DisableExplicitGC setting will ignore these method calls which are undermines the GC tuning efforts. Take a look for “Full GC (System)” entries on your GC log files. Third tip is to take a look at the Standard Performance Evaluation Corporation and how they configure the JVM for Weblogic in order to get best performance (move on the result page, look for a Weblogic test on our platform and take a look on the JVM settings at the Notes/Tuning Information section).

